
Integral field spectroscopy
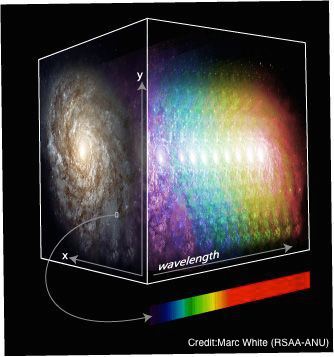
Integral field spectrographs (also known as integral field units, or IFUs) have the capability of obtaining spatially and spectrally resolved images of the targeted object. This means that, for each individual pixel of an IFU image, there is a spectrum spanning over the entire wavelength range of the instrument. The image obtained from the observations is therefore not a 2D image at all, but rather a 3D data cube, where the two spatial dimensions (right ascension and declination) are extended by the third spectral dimension.
The advantage of an IFU is that, on top of the photometric inforamtion, a kinematical analysis is made possible. I have been working with data from the optical IFU MUSE and the near-infrared IFU KMOS (both mounted on the Very Large Telescope in Chile), targeting star forming regions in the Milky Way and soon also in our neighbour, the Large Magellanic Cloud. With the data I try to understand how we can trace and quantify the feedback of star formation in these regions.
The challenge of using IFUs for nearby star forming regions is given by the fact that one single telescope pointing is not enough to cover the entire desired area: instead, we have to rely on making mosaics, which (after data reduction) correspond to very big datacubes up to GB sizes. Handling these cubes in a smart way, and especially, analysing them, can be a challenge, and that is why I decided to make the scripts I have written for this purpose available to the public. Soon, you will be able to use MUSEpy for your MUSE data, and the upgraded version of it (IFUpy) for your IFU datacubes!
Visit the MUSE science website