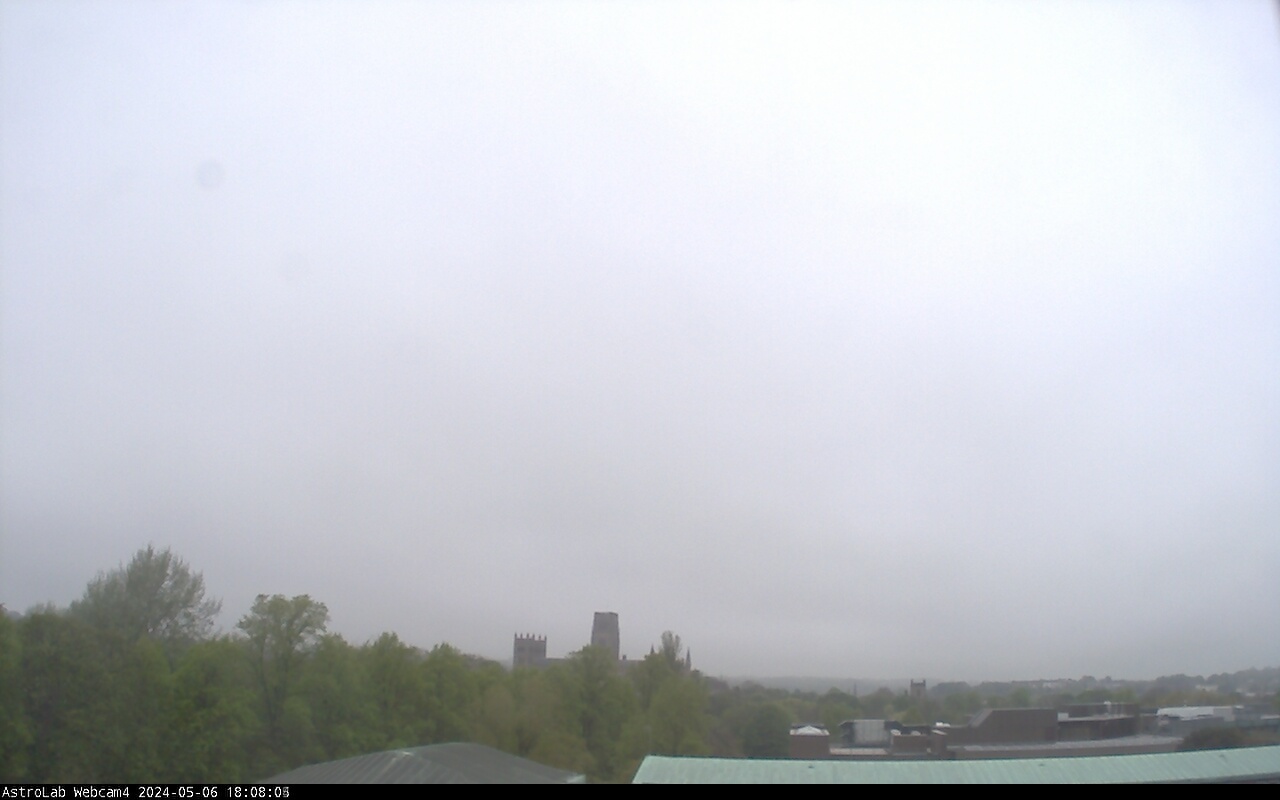
Cathedral view

In 1610, Galileo Galilei made a series of observations of Jupiter and discovered four objects that appeared to be moving around the planet. These were the largest of Jupiter's moons, now known as the Galilean moons: Io, Europa, Ganymede, and Callisto. This discovery was significant at the time as it provided strong evidence against the prevailing geocentric model of the Universe, which held that all celestial bodies orbited the Earth. The presence of moons orbiting Jupiter supported the heliocentric model proposed by Nicolaus Copernicus, where planets orbit the Sun. Now we know Jupiter is the largest planet in the solar system, with over 90 satellites (and counting!). The largest is Ganymede which is about three-quarters the size of Mars, which orbits Jupiter in a period of about 7 days. Other Galilean moons orbit Jupiter with periods ranging from 2 to 16 days, some in resonance with each other.
The goal of the project is to obtain a mass estimate of Jupiter. You will do this by obtaining a series of images of Jupiter and its satellites so that the orbital periods of as many of the satellites as possible can be determined. From this data you will infer the orbital periods of Jupiter's moons and measure their semi-major axis. The mass of Jupiter will then be estimated using Kepler's third law.
Identify archival observations of Jupiter, possibly using the same telescope for ease. Inspect some of the archival images and determine which moons are visible.
Determine the plate scale of the CCD detector from the archivalk images (i.e. what is the relation between pixels to arcseconds).
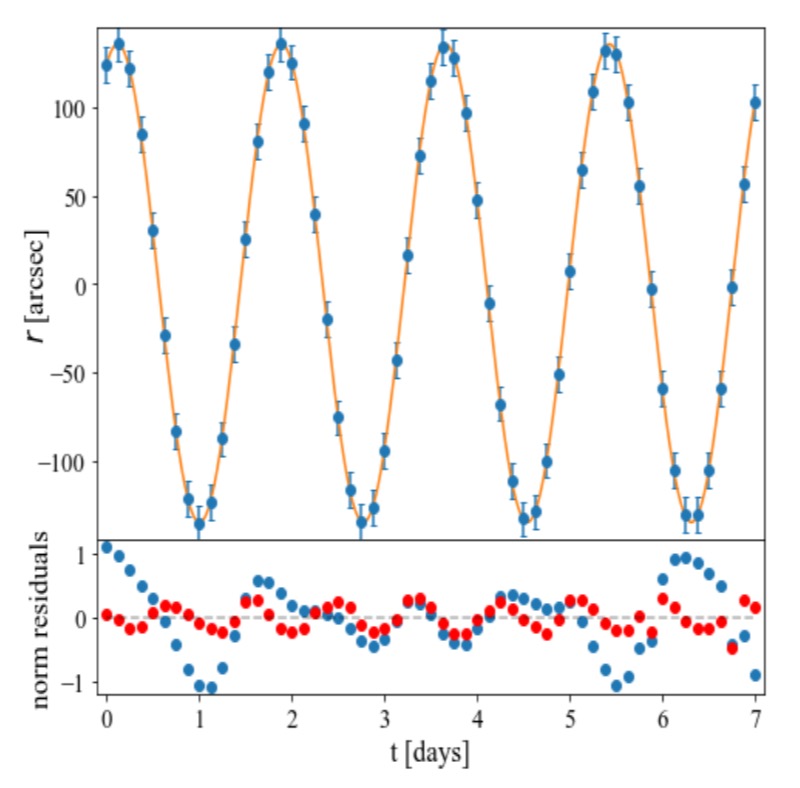
Determine the orbital period of each of the satellites visible in the archival images. You can do this by measuring the separation between the satellite and Jupiter in each image (using e.g. ds9), and then plotting the separation (in what units? pixels?) as a function of time. You should see a sinusoidal variation in the separation, with a period equal to the orbital period of the satellite. You can then fit a (sine?) curve to the data to determine the period. Do this for as many moons as available in the images. Look at your residuals and establish a goodness-of-fit if required.
Here an example plot using Ganymede (done by L3 AstroLab student Thai):
Use your determination of the plate scale to determine the semi-major axis of each of the satellites. You can then estimate the mass of Jupiter, and think about the propagated errors on this measurment.
Compare your measurment to the known mass of Jupiter and identify any potential systematic uncertainties.
Cathedral view
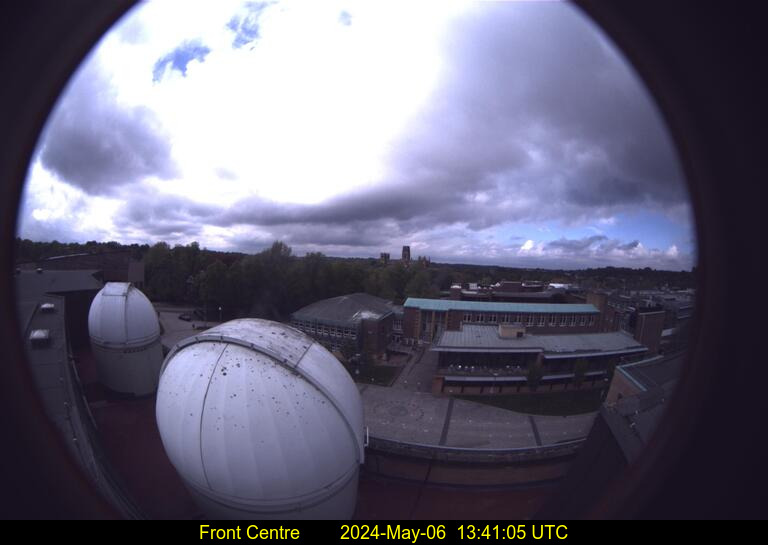
Roof Front-Centre
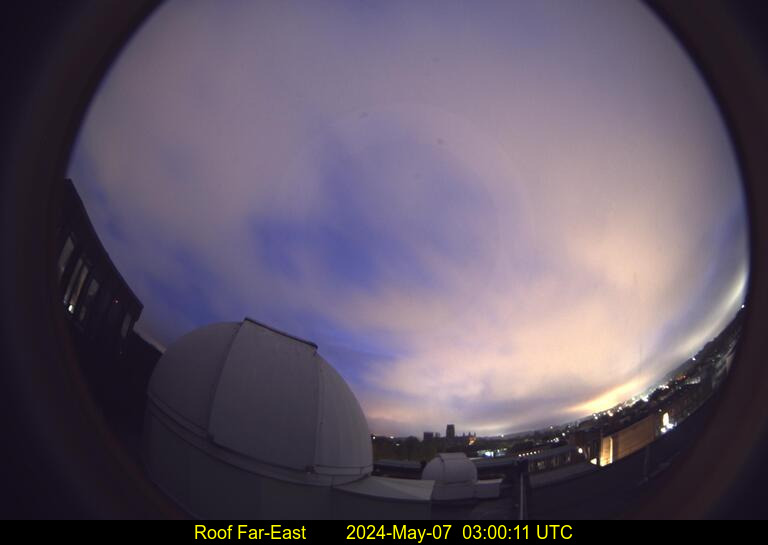
Roof Far-East
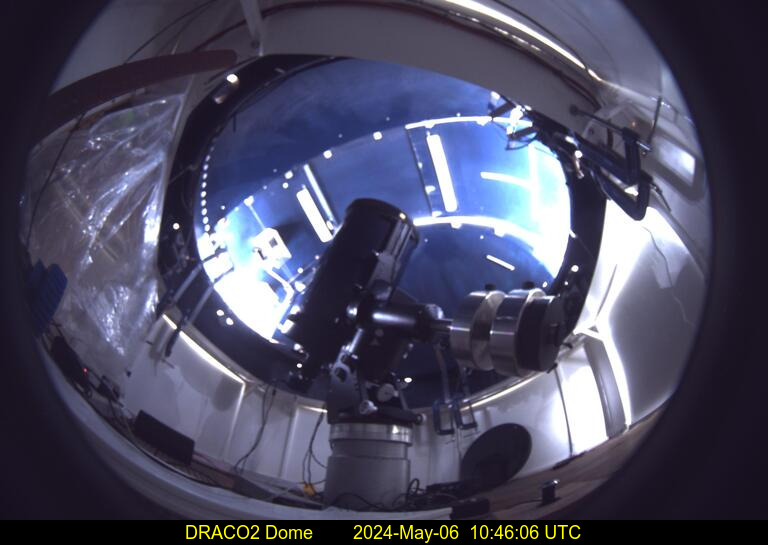
Draco2
East-16
FE20
West-14