Cathedral view

Star formation is one of the least understood processes in astrophysics. It is difficult to formulate a general theory for star formation in part because of the wide range of physical processes involved (e.g. Krumholz et al. 2011). The interstellar gas out of which stars form is a turbulent plasma governed by magnetic fields, radiative processes and further influenced by gravity. The behavior of star-forming clouds is further influenced by a wide variety of chemical processes, including formation and destruction of molecules and dust grains. As a result of these complexities, we are still limited to making empirical measurements to constrain how stars form from the gas, and one of the most basic measurements is the mass of a star forming region, and the rate at which this gas is converted in to stars (the star formation efficiency; e.g. Murray et al. 2010 ).
Hydrogen is the most abundant element. At the high densities where stars form, hydrogen tends to be molecular rather than atomic, although H2 is extremely hard to observe directly. Instead we are forced to observe proxies. The most straightforward conceptually is dust. Interstellar gas clouds are always mixed with dust, and the dust grains absorb background starlight.
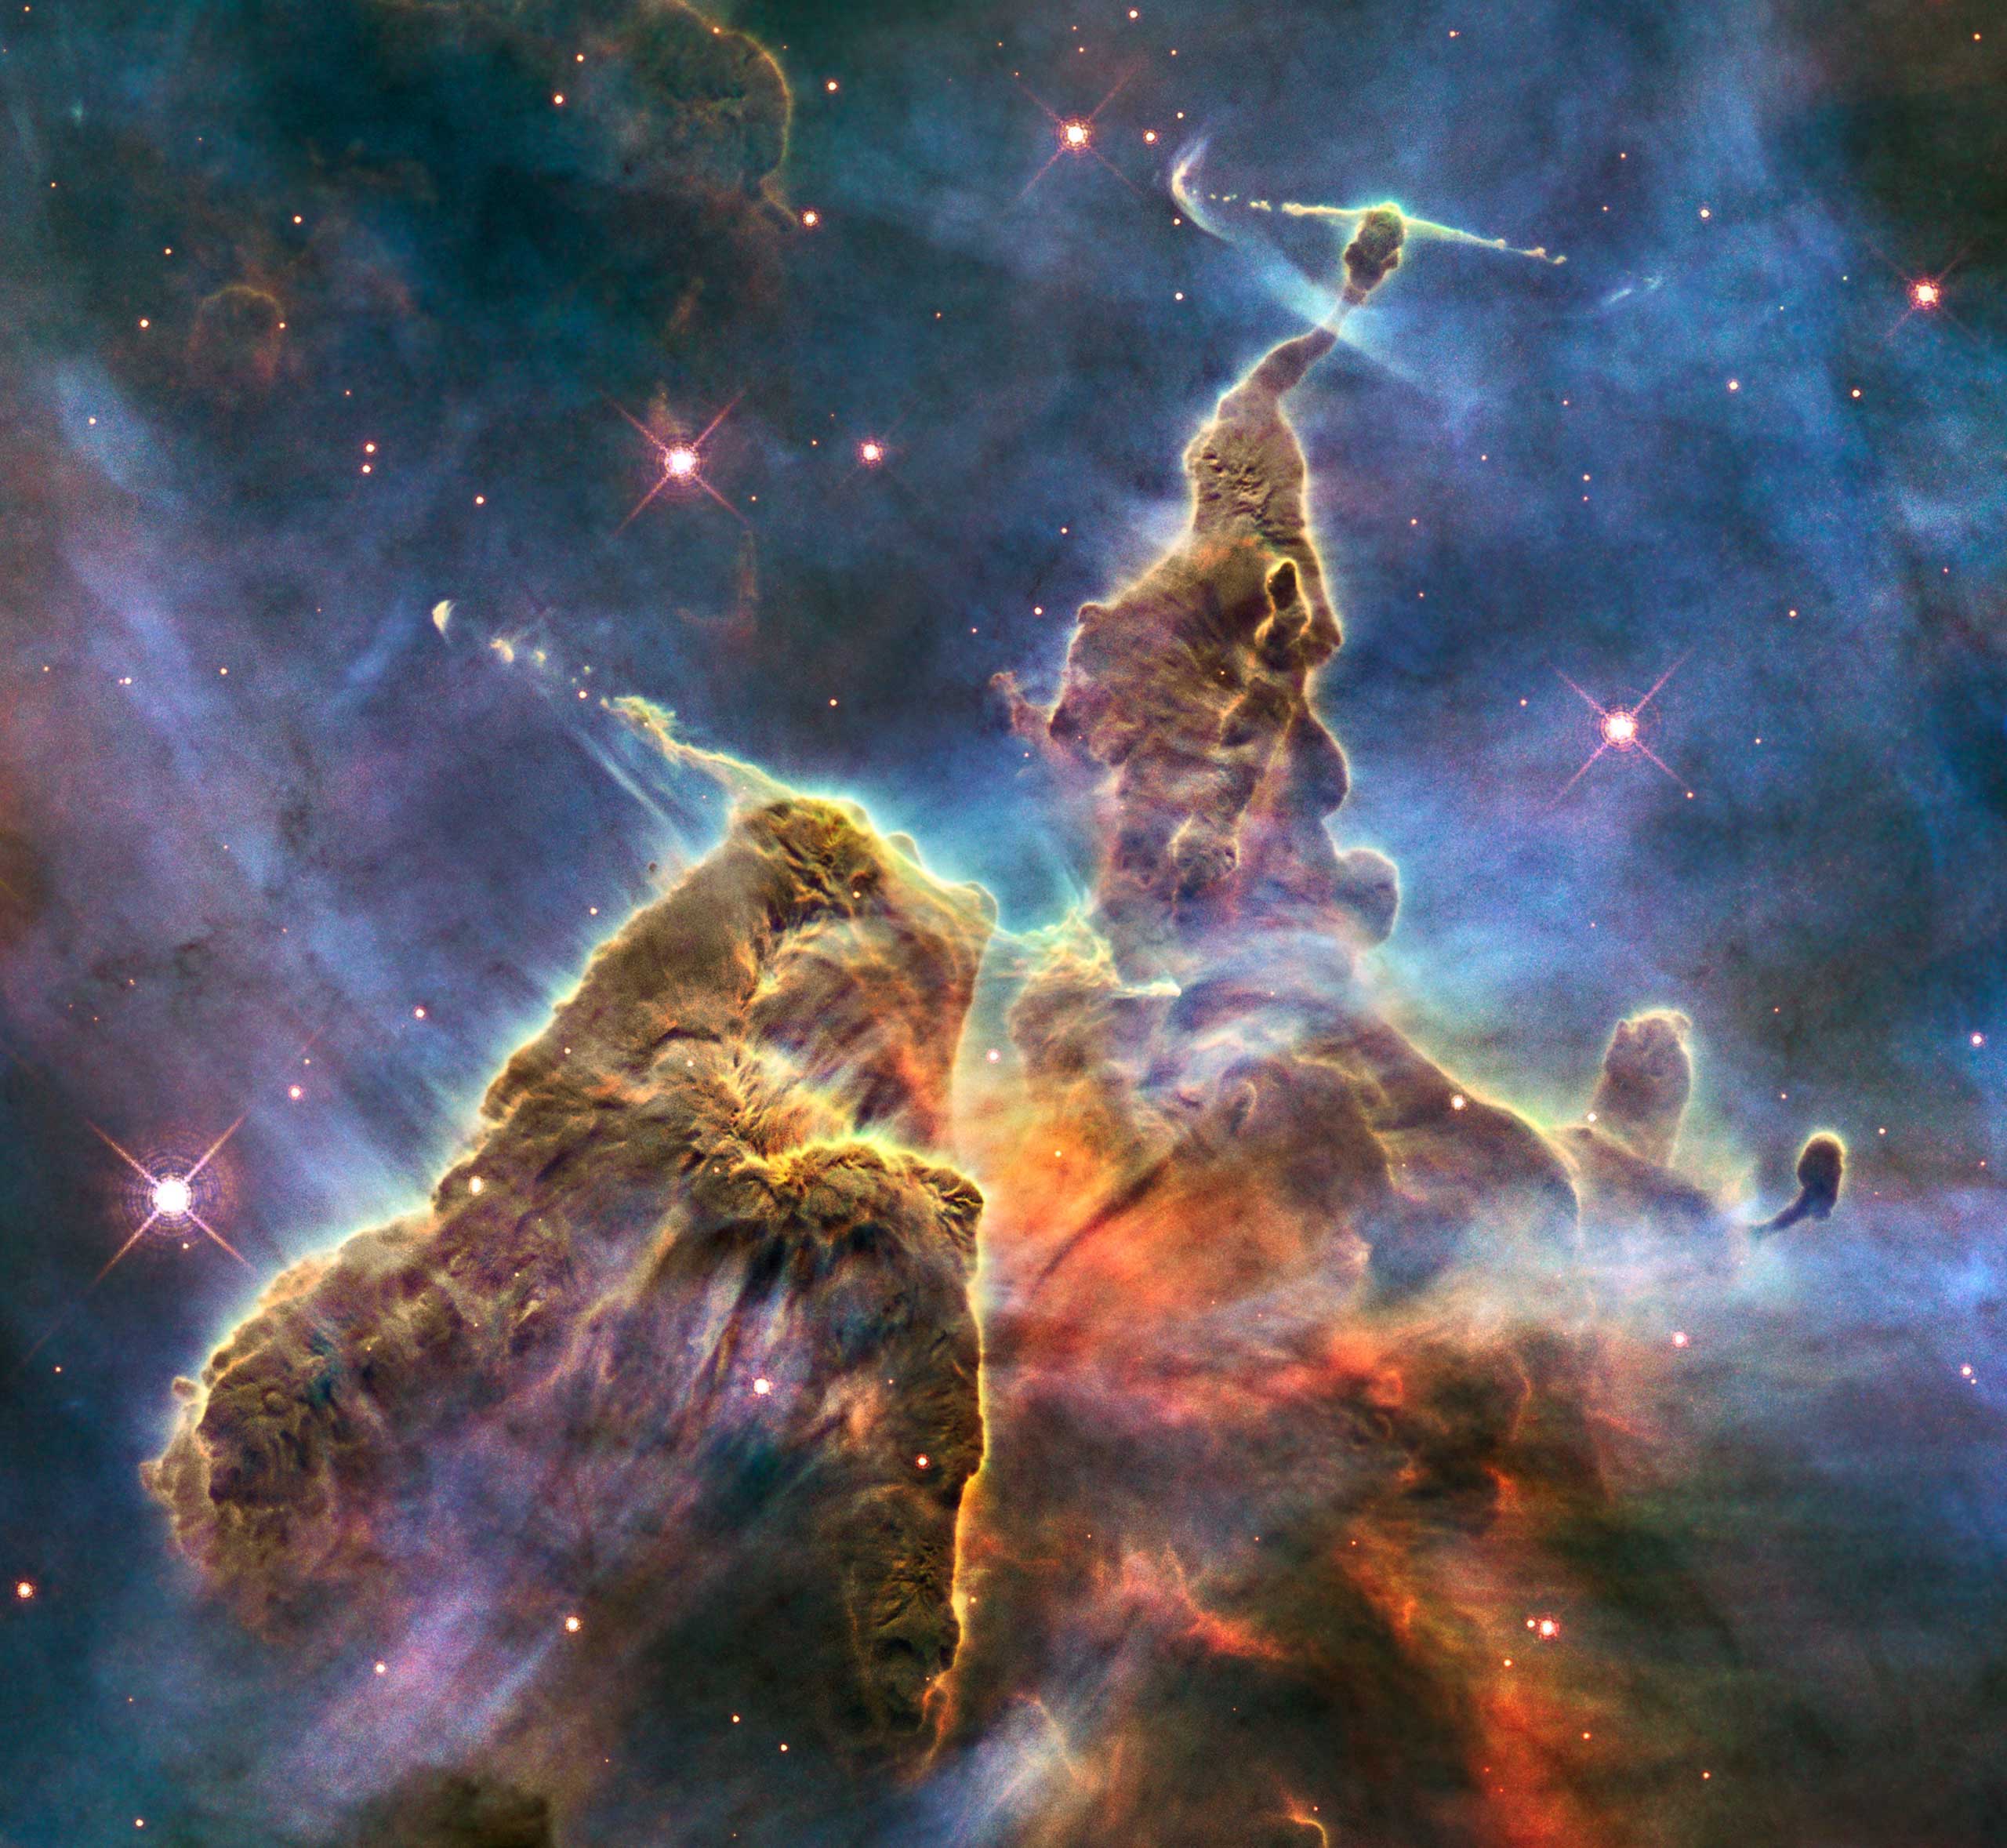
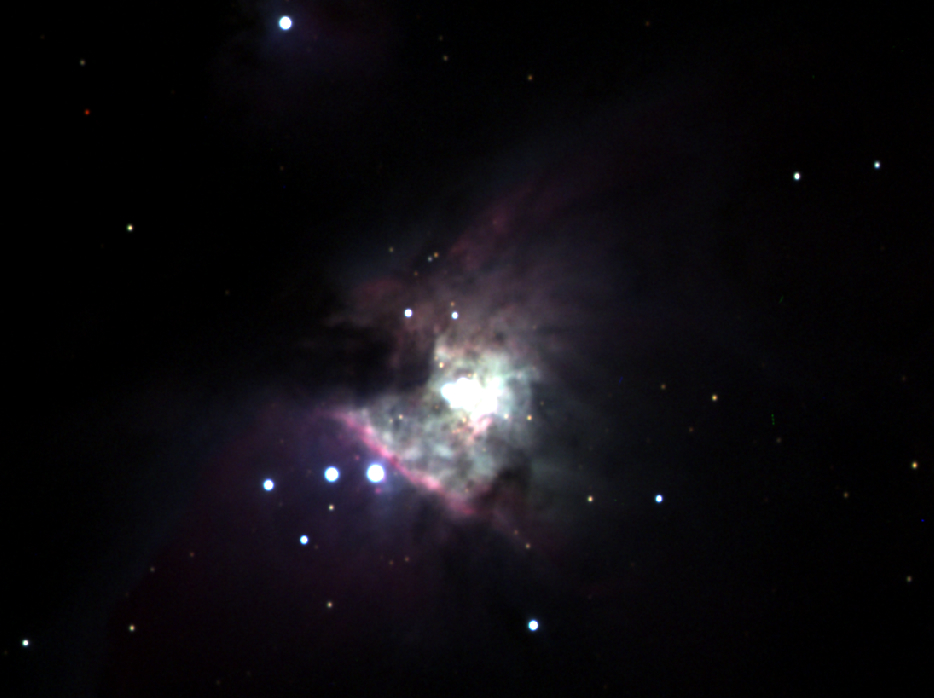
The goal of this project is to identify a (nearby) star forming region (e.g. M42), and measure the colours of the embedded stars. By comparing the observed colours of the stars with their theoretical (unobscured) colours, the H2 column density can be inferred and, with an estimate of the size of the cloud, the total mass can be inferred.The above image shows a region around the pillars of creation, the star forming region made famous by the Hubble Space Telescope. Notice how the stars all appear red -- a consence of the interstellar dust and gas preferentially absorbing blue wavelengths.
The goal of this project is to make observations and measure the colours of stars embedded in a star forming region, and use the colour excess to infer the hydrogen mass of the cloud. Here are some suggestions for the project and measurements that you may wish to think about. Note that all data reduction and analysis can either be done in Python or AstroImageJ.
Identify a suitable target (or targets) and the conduct observations. The stars in the region you have identified must have measured spectral types (since we will need to compare the observed colours to their intrinsic colours). The nebular in M42 is a good target (e.g. Muench et al. 2008), but there may be others. For the observations, you will need to choose your observing time carefully. Remember, these are 16-bit detectors and saturate with 65,536 counts. You should think (and worry?) about the CCD linearity. What effects will non-linearity have on your results? Can you ensure the CCD behaves linearly? linear? Conduct observations in B and V (adding R will make a nice colour image!)
Stack the images to construct a mosaic from which the measurements can be made. The stacking procedure is detailed here.
Derive the zero-point for the image. Information about the Python script which can be used to zero-point image can be found here. If you'd like to do this in Python. Else you can use AstroImageJ.
Use GAIA to measure the magnitude of the stars from the mosaic, applying the zero point. Also, record the number of counts from the star and sky background. Which dominates?
Calibrate the CCD to test whether the images are read-noise-, dark-current-, sky-noise-, or photon-noise- limited. You may want to check that signal is linear. For the read-noise, you could obtain a a set (short) dark images from which you can check the noise in a single pixel (or set of pixels). For the dark current, measure the signal in "dark" mode as a function of exposure time. What is the Bias level? Check the linearity to ensure your magnitudes are reliable? Measure the gain (why might this be important?)
With all of the calibrations made, calculate the error on the magnitude. Are the errors dominated by photon-noise, sky-noise, read-noise, or dark current?
Look up the spectral types of the stars. For M42, the spectral types for the stars in Trapezium can be found in Simon-Diaz et al. (2006).
Find the theoretical colours of stars with the same spectral types, and measure the colour excess:
E(B-V) = (B-V)observed-(B-V)intrinsic AV = R x E(B-V) AV) using the calibration
between N(H) and AV
in Guver et
al. 2009.
Extra!
Need an extra challenge? Can you estimate the gas depletion time for the cloud. i.e. how long before M42 has consumed all of its gas and converted it into stars? You will need to convert the total luminosity into a star formation rate. A good starting point is to look at Kennicutt 1998 and Harwit et al. 1982.
Cathedral view
Roof Front-Centre
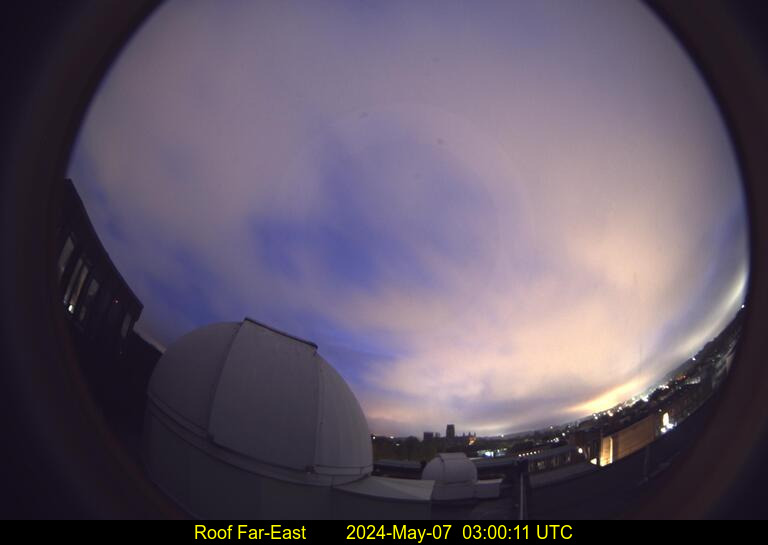
Roof Far-East
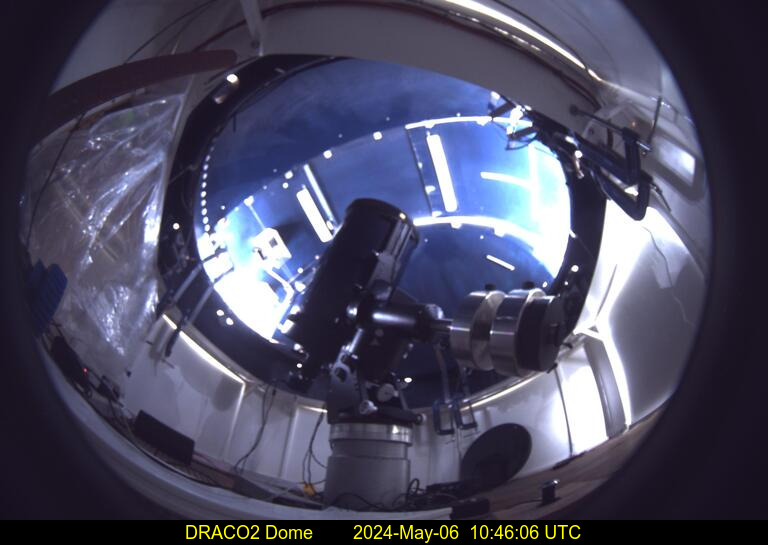
Draco2
East-16
FE20
West-14